Tracing interpolation
Tip
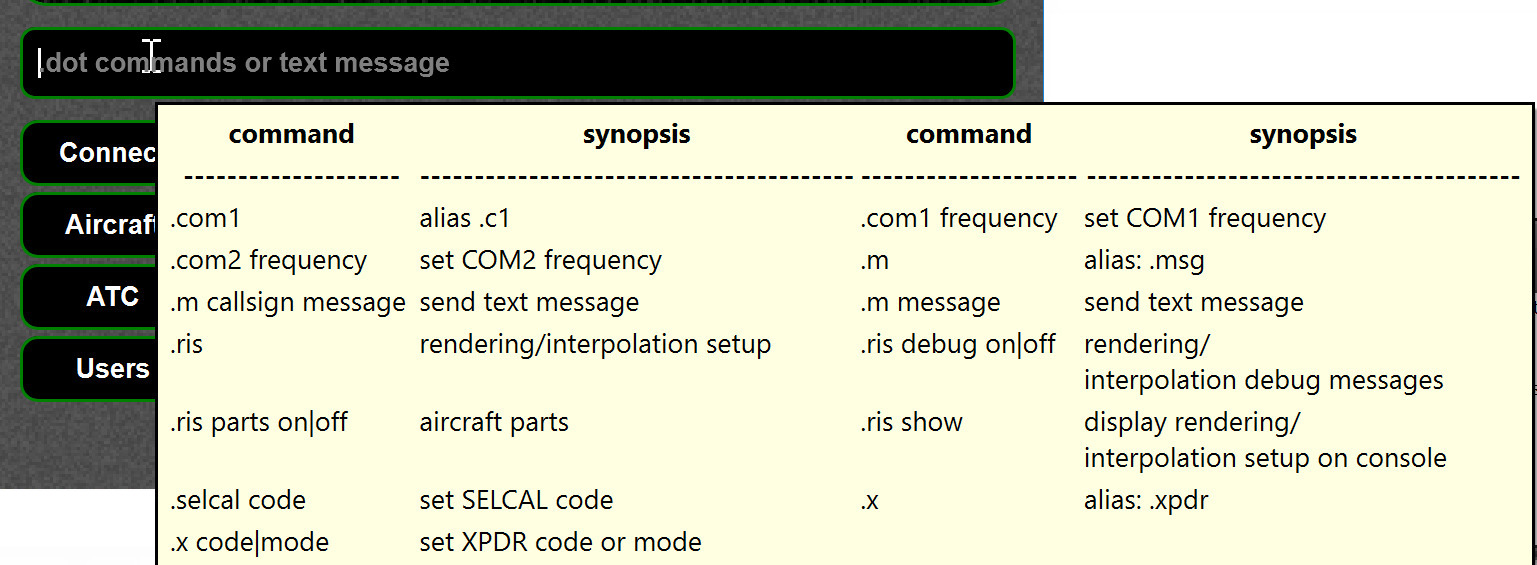
Use the "dot" command help to see which commands can be used to enable interpolation logging
Overview
There are 3 possibilities to get interpolation information:
- in an extra window of swift (since 0.8.4): interpolation page
- in the message window of X-Plane/FSX/P3D. You can send the current interpolated situation as message to the sim, which is useful if you want so see it in the simulator together with the aircraft
- or saved into a log file in HTML format which can also be read by spreadsheet programs. (HTML table will be created from that, which also be imported by Excel and similar spreadsheet programs)
HINT: You can enable logging for 1..n aircraft, but only use ONE aircraft if there is no special need
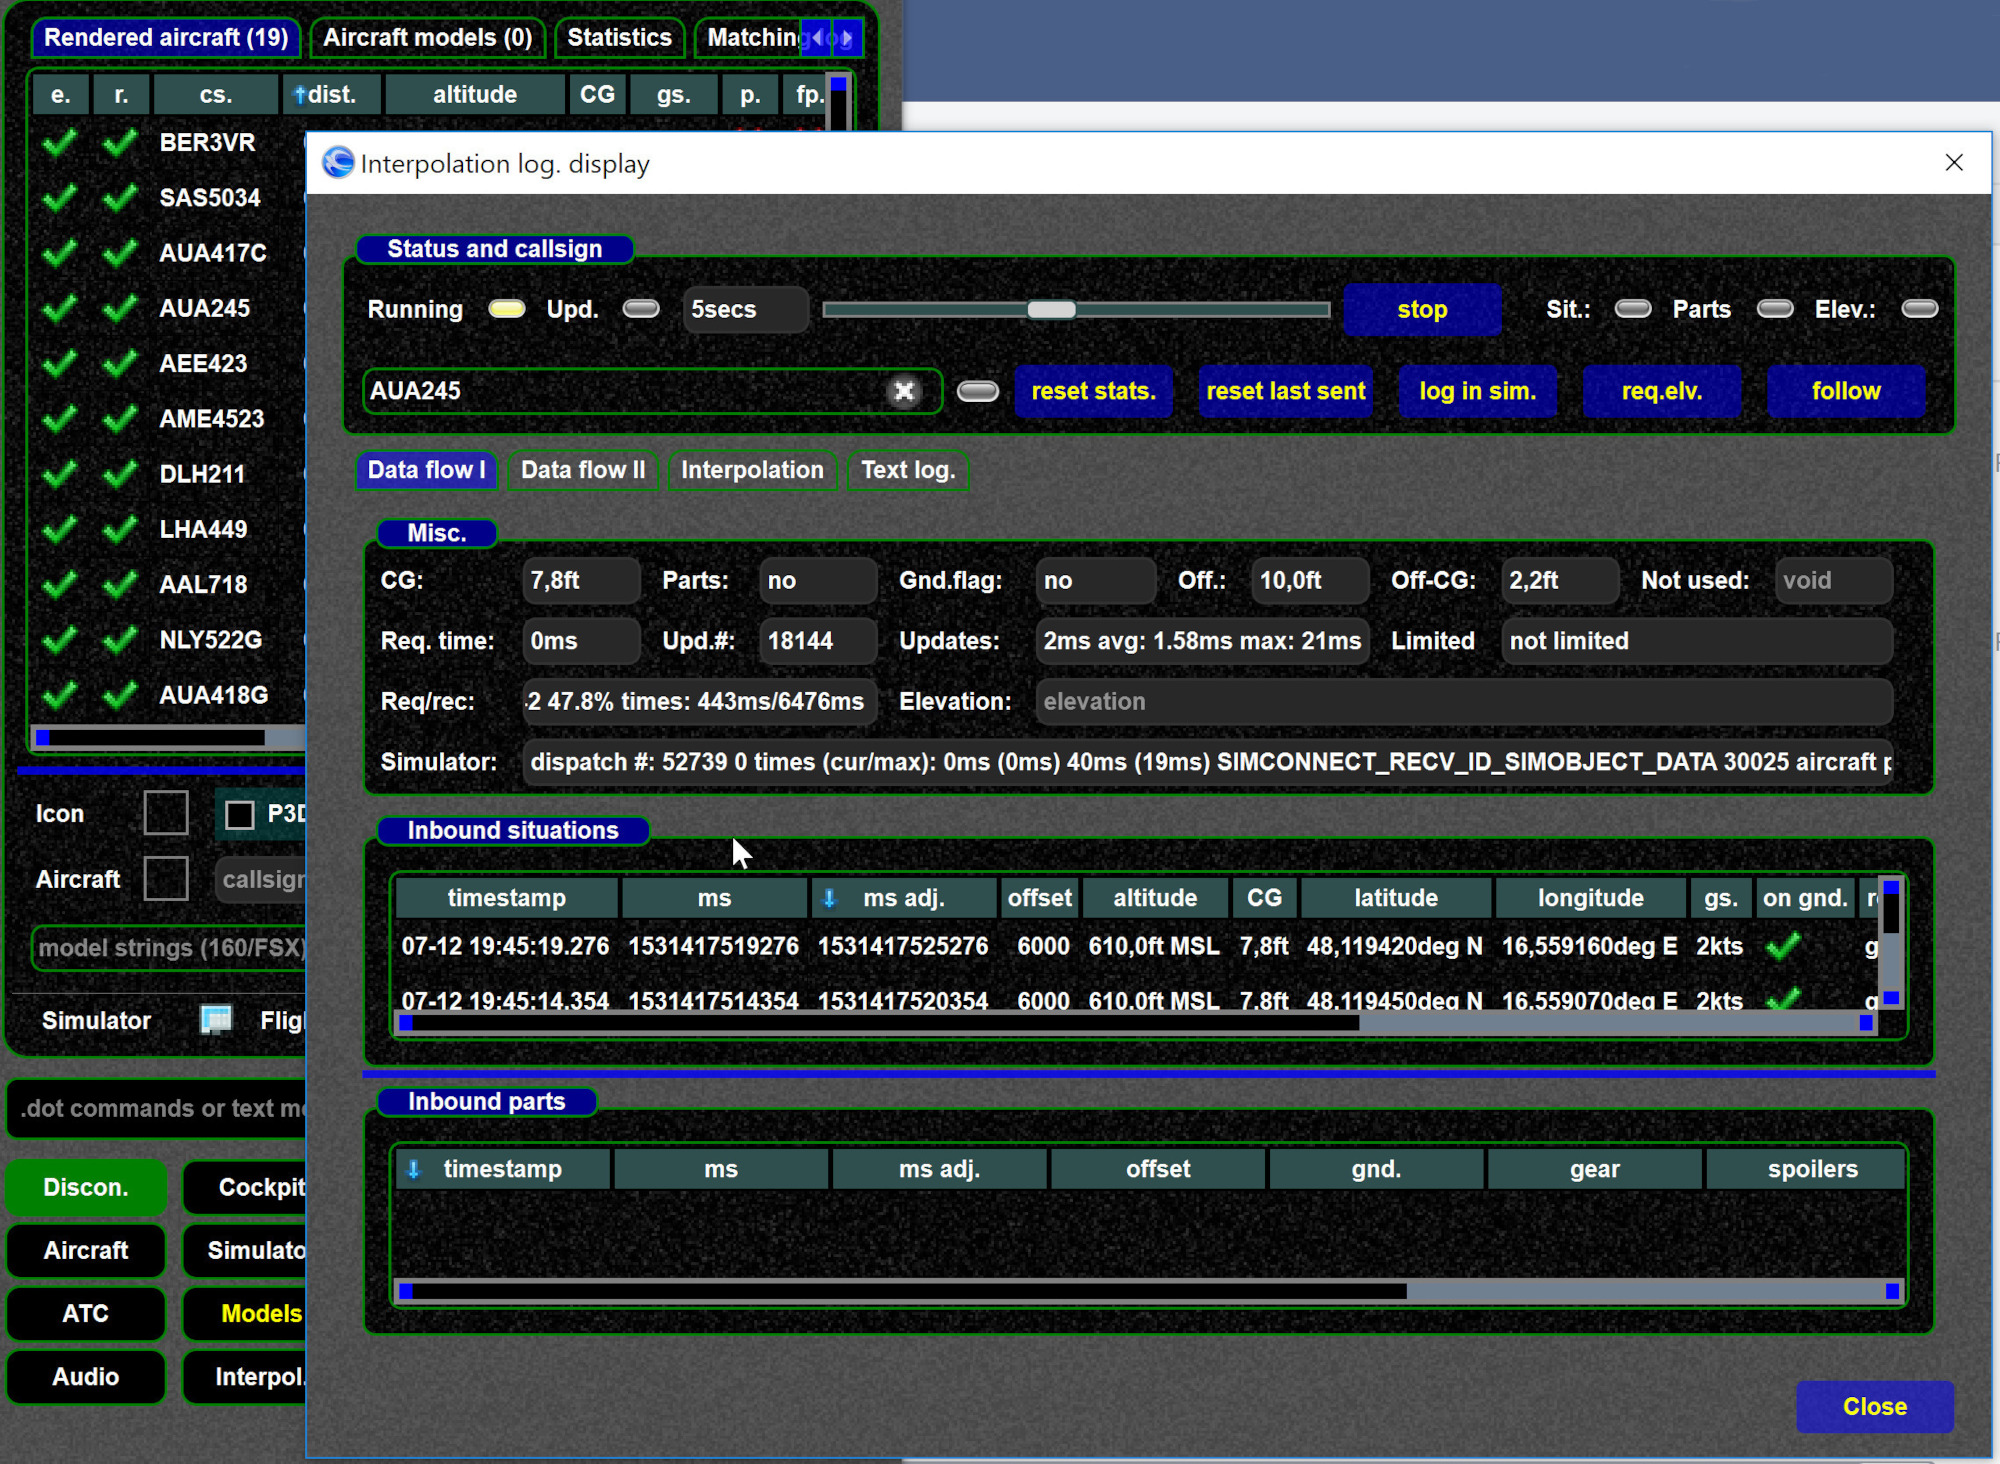
Interpolation log display
The interpolation log. display allows to trace interpolation, checking elevations, inbound parts and situations. It is most likely the easiest was to trace interpolations.
Use .drv intdisplay to launch the window.
See interpolation page for details.
Full HTML log
-
You can enable tracing via the dot command
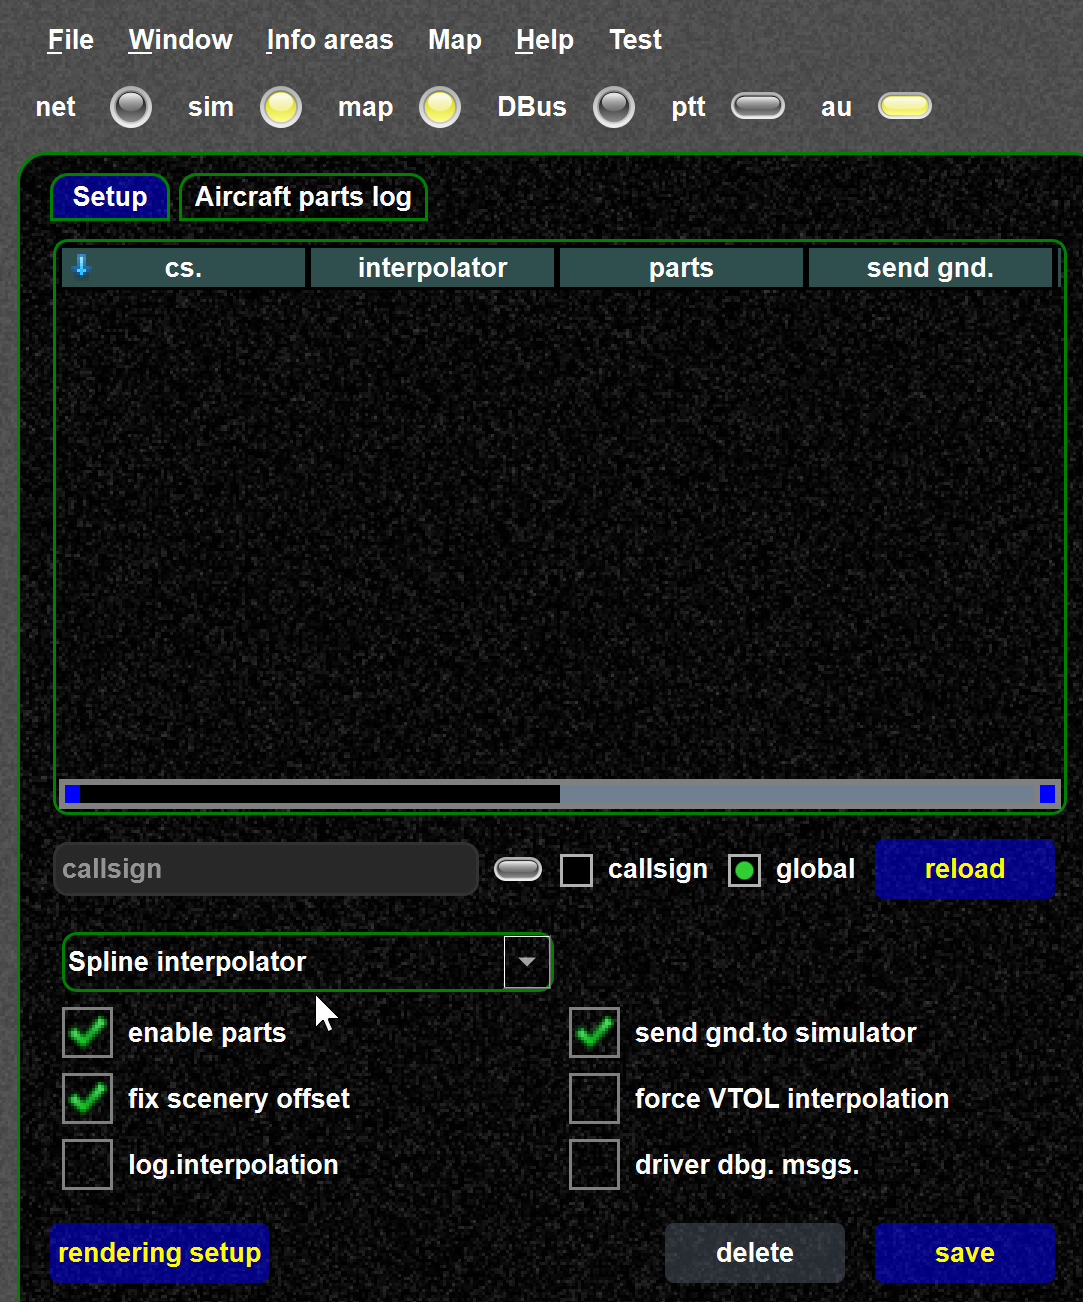
.drv logint CALLSIGN. Alternatively logging can be enabled (or checked if it is enabled) in interpolation setup. You should see an info in the log./status bar
-
if you want to end the logging, you would type
.drv logint write, this should show
-
the logging is very VERBOSE, so we recommend ONLY to log one callsign at a time
- do not log for too long, as said, the logs files get huge very quickly
- you will find the situation and parts logs generated in the log directory (they will be written if you type
.drv logint write) - If you have no idea how to find the log directory, see find log files
The complete log can be obtained as HTML from the Internals page
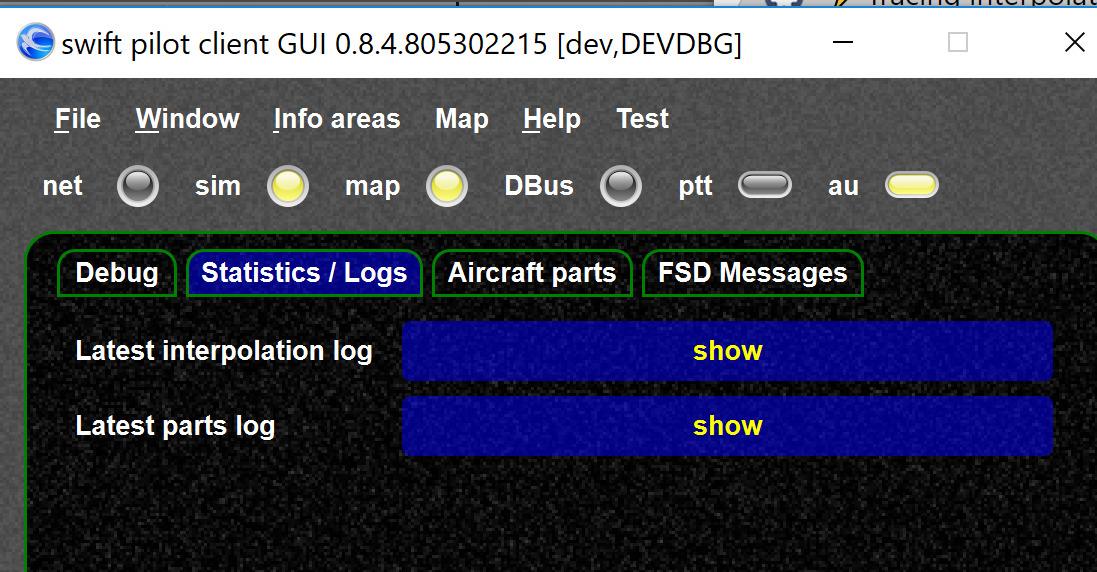
Testing aircraft parts
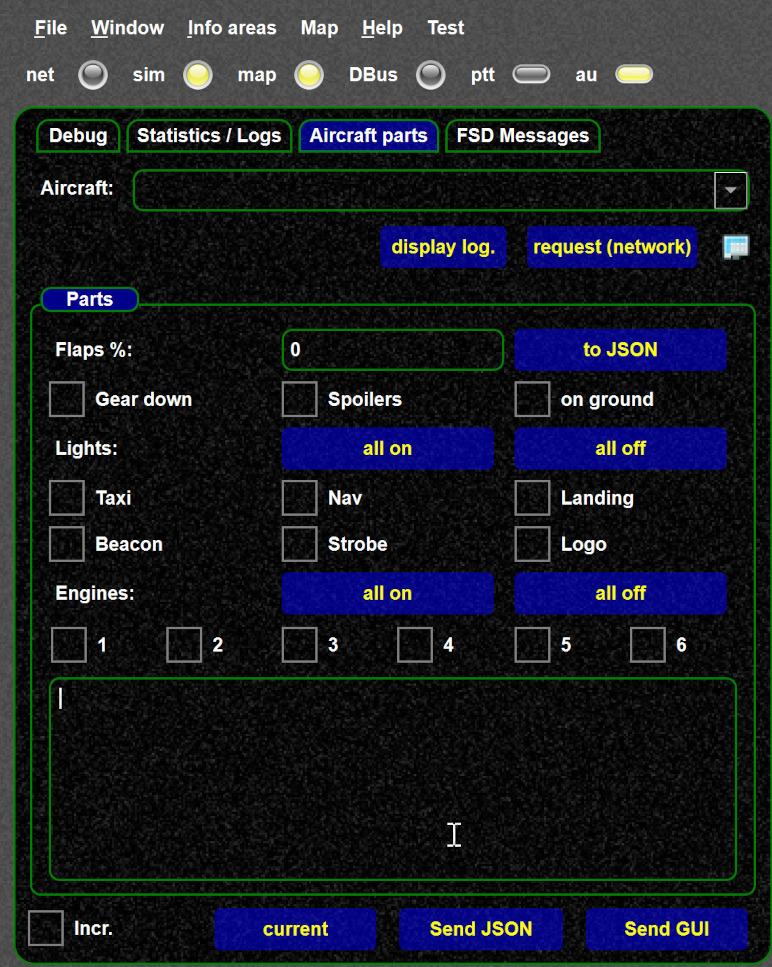
In interpolation setup (on the 2nd tab) you could check the aircraft parts if needed.
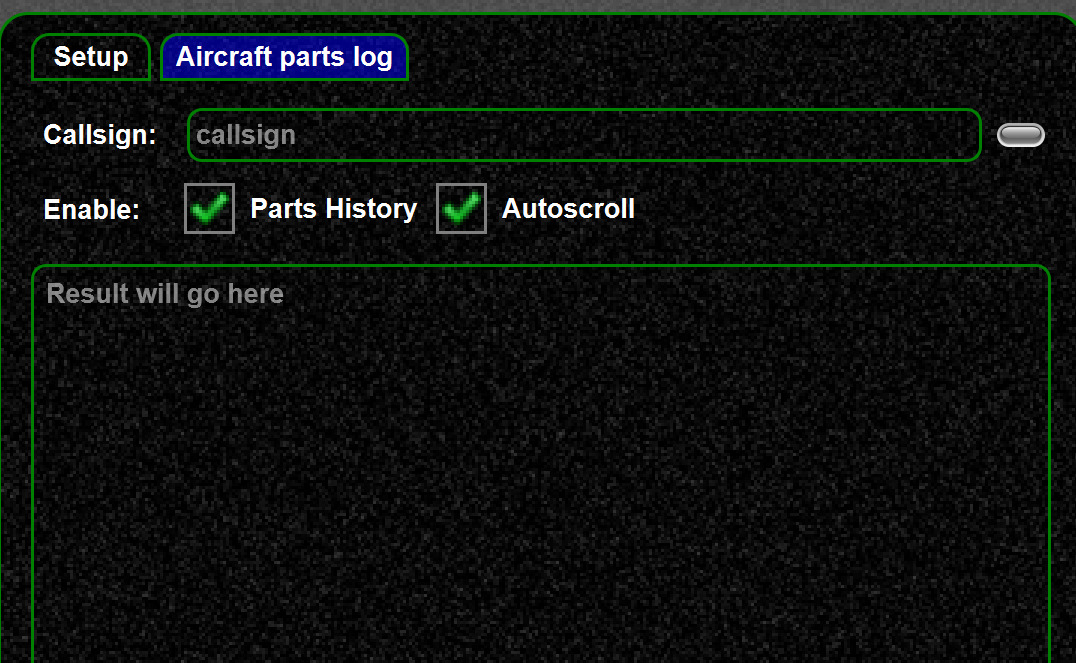
For testing parts you can also use the Internals page for sending parts.
